Project Challenges
Despite recognition of the critical importance of wetlands in maintaining a wide range of environmental, economic, and societal benefits, it has been nearly impossible to map or model the complexity of the Poyang Lake system or to forecast project proposed changes, such as fixed water levels. Quite simply, there has been no way to monitor, especially given the very large number ofmany local, independent actors that affect the wetland system.
Project Aims
We seek to improve the knowledge base regardingseek to identify and map the spatial and temporal dynamics in the Poyang Lake Region, to better understand the actors involved in recent and ongoing changes, and most critically, to provide simulateions that illustrate the range of possible outcomes that may result from local and institutional decision-makingwater controls.
To achieve these goals, our multi-disciplinary research program has four main objectives:
- Detect, measure, and characterize basin-wide land cover and water extent at multiple time points using highly detailed satellite remote sensing data;
- Pilot a citizen-science mobile app to collect local water gate locations and elevations, and to capture fisherman choices in sub-lake water gate control and management;
- Link the spatially- and temporally-explicit datasets on land cover, inundation extent, and sub-lake management;
- Use these empirical mapping and modeling results to develop possible trajectories of change in the Poyang ecosystem.
Project Achievements
The map gallery below shows the initial study achievement:
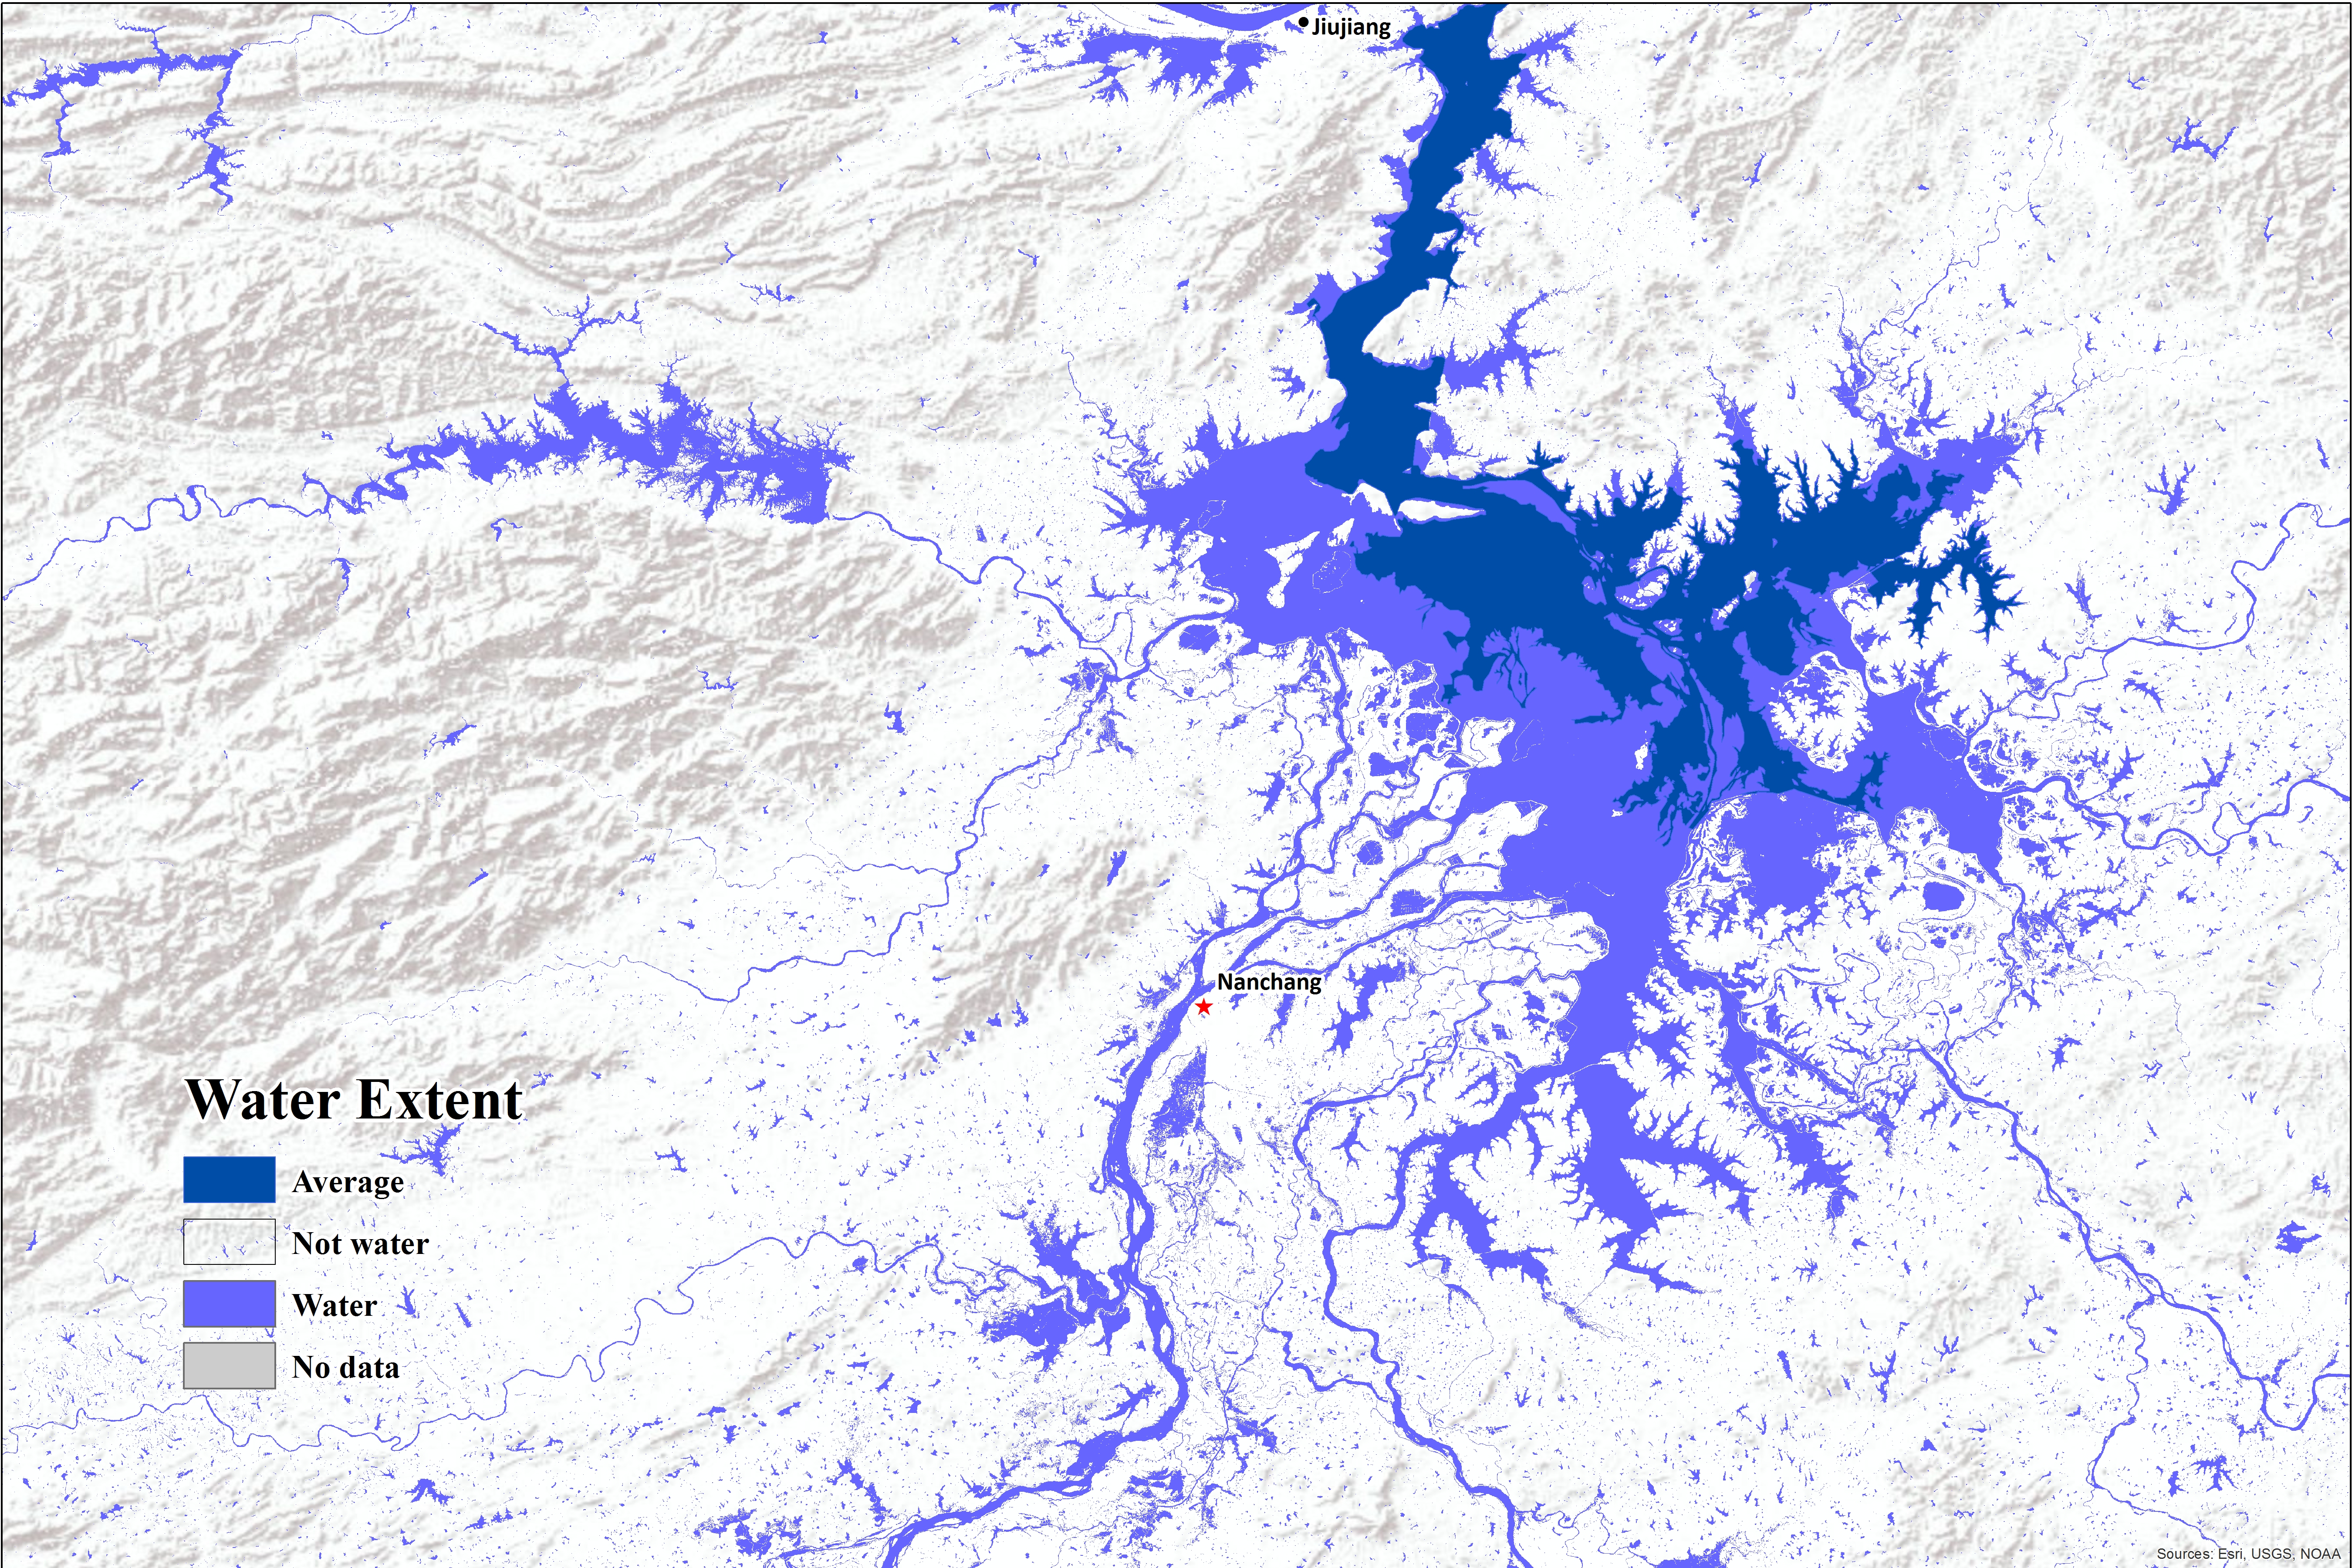
The Surface Water Maximum Water Extent shows all the locations ever detected as water over a 32-year period (1984-2015).
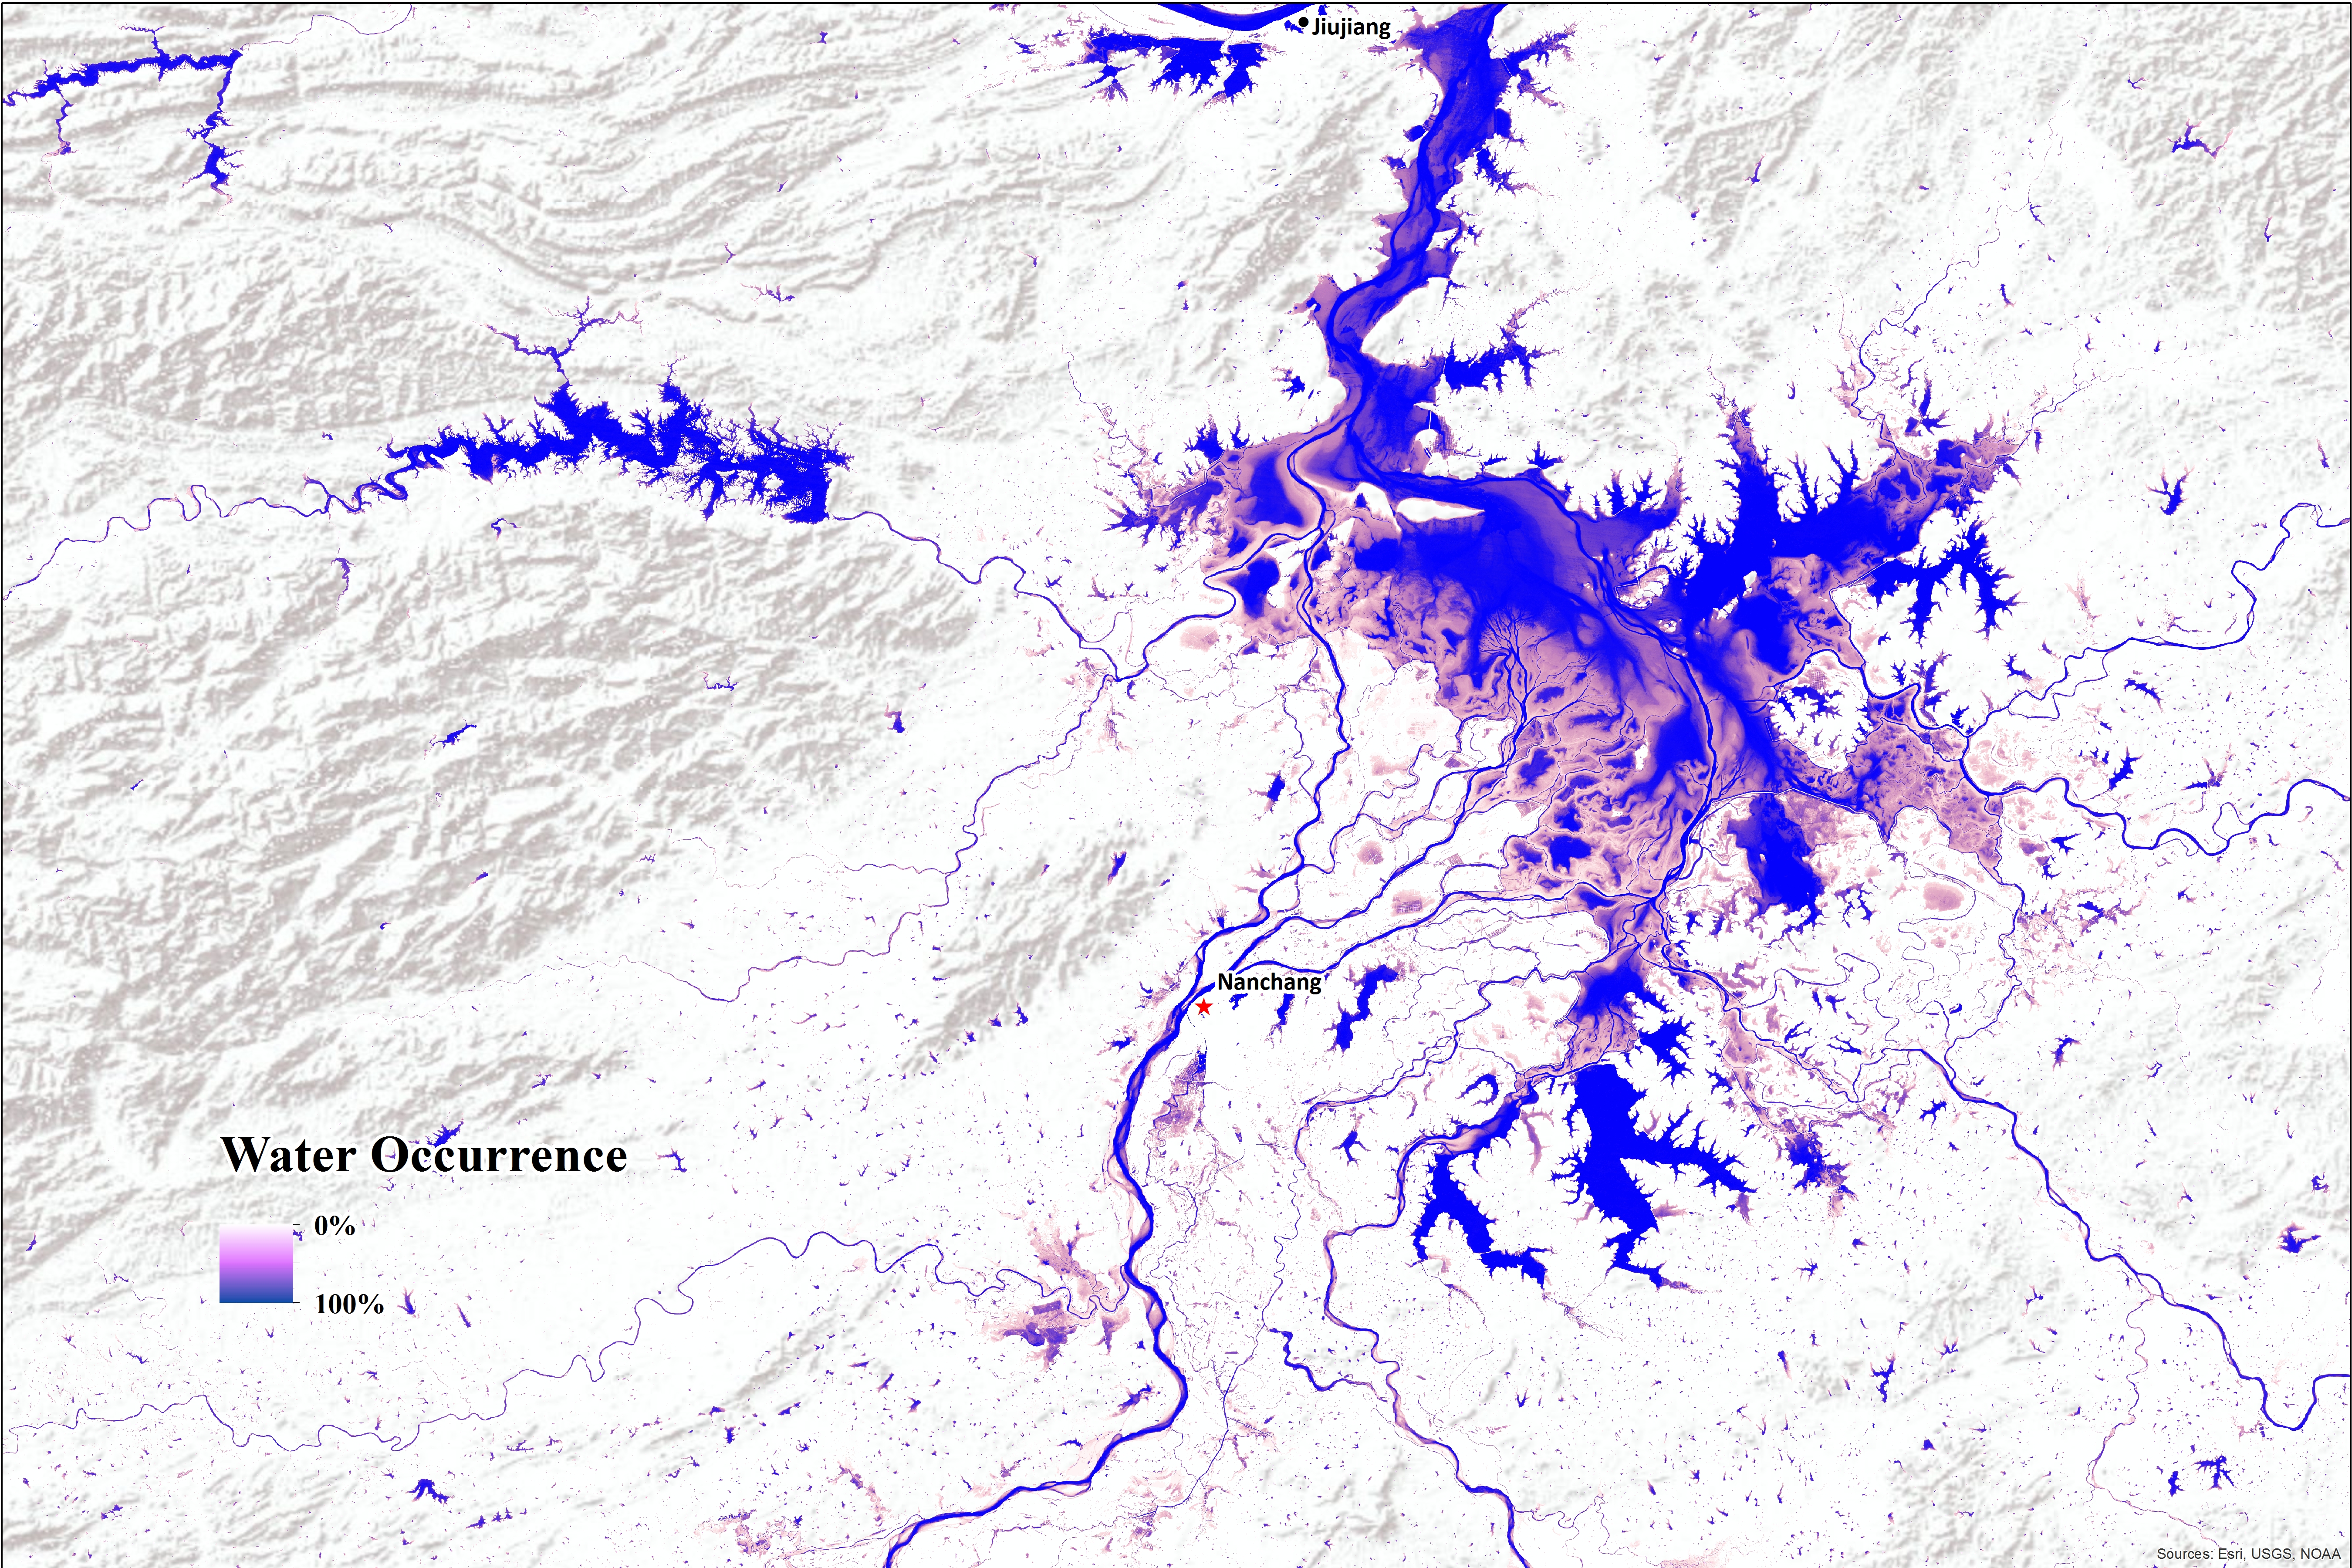
The Surface Water Occurrence shows where surface water occurred between 1984 and 2015 and provides information concerning overall water dynamics.
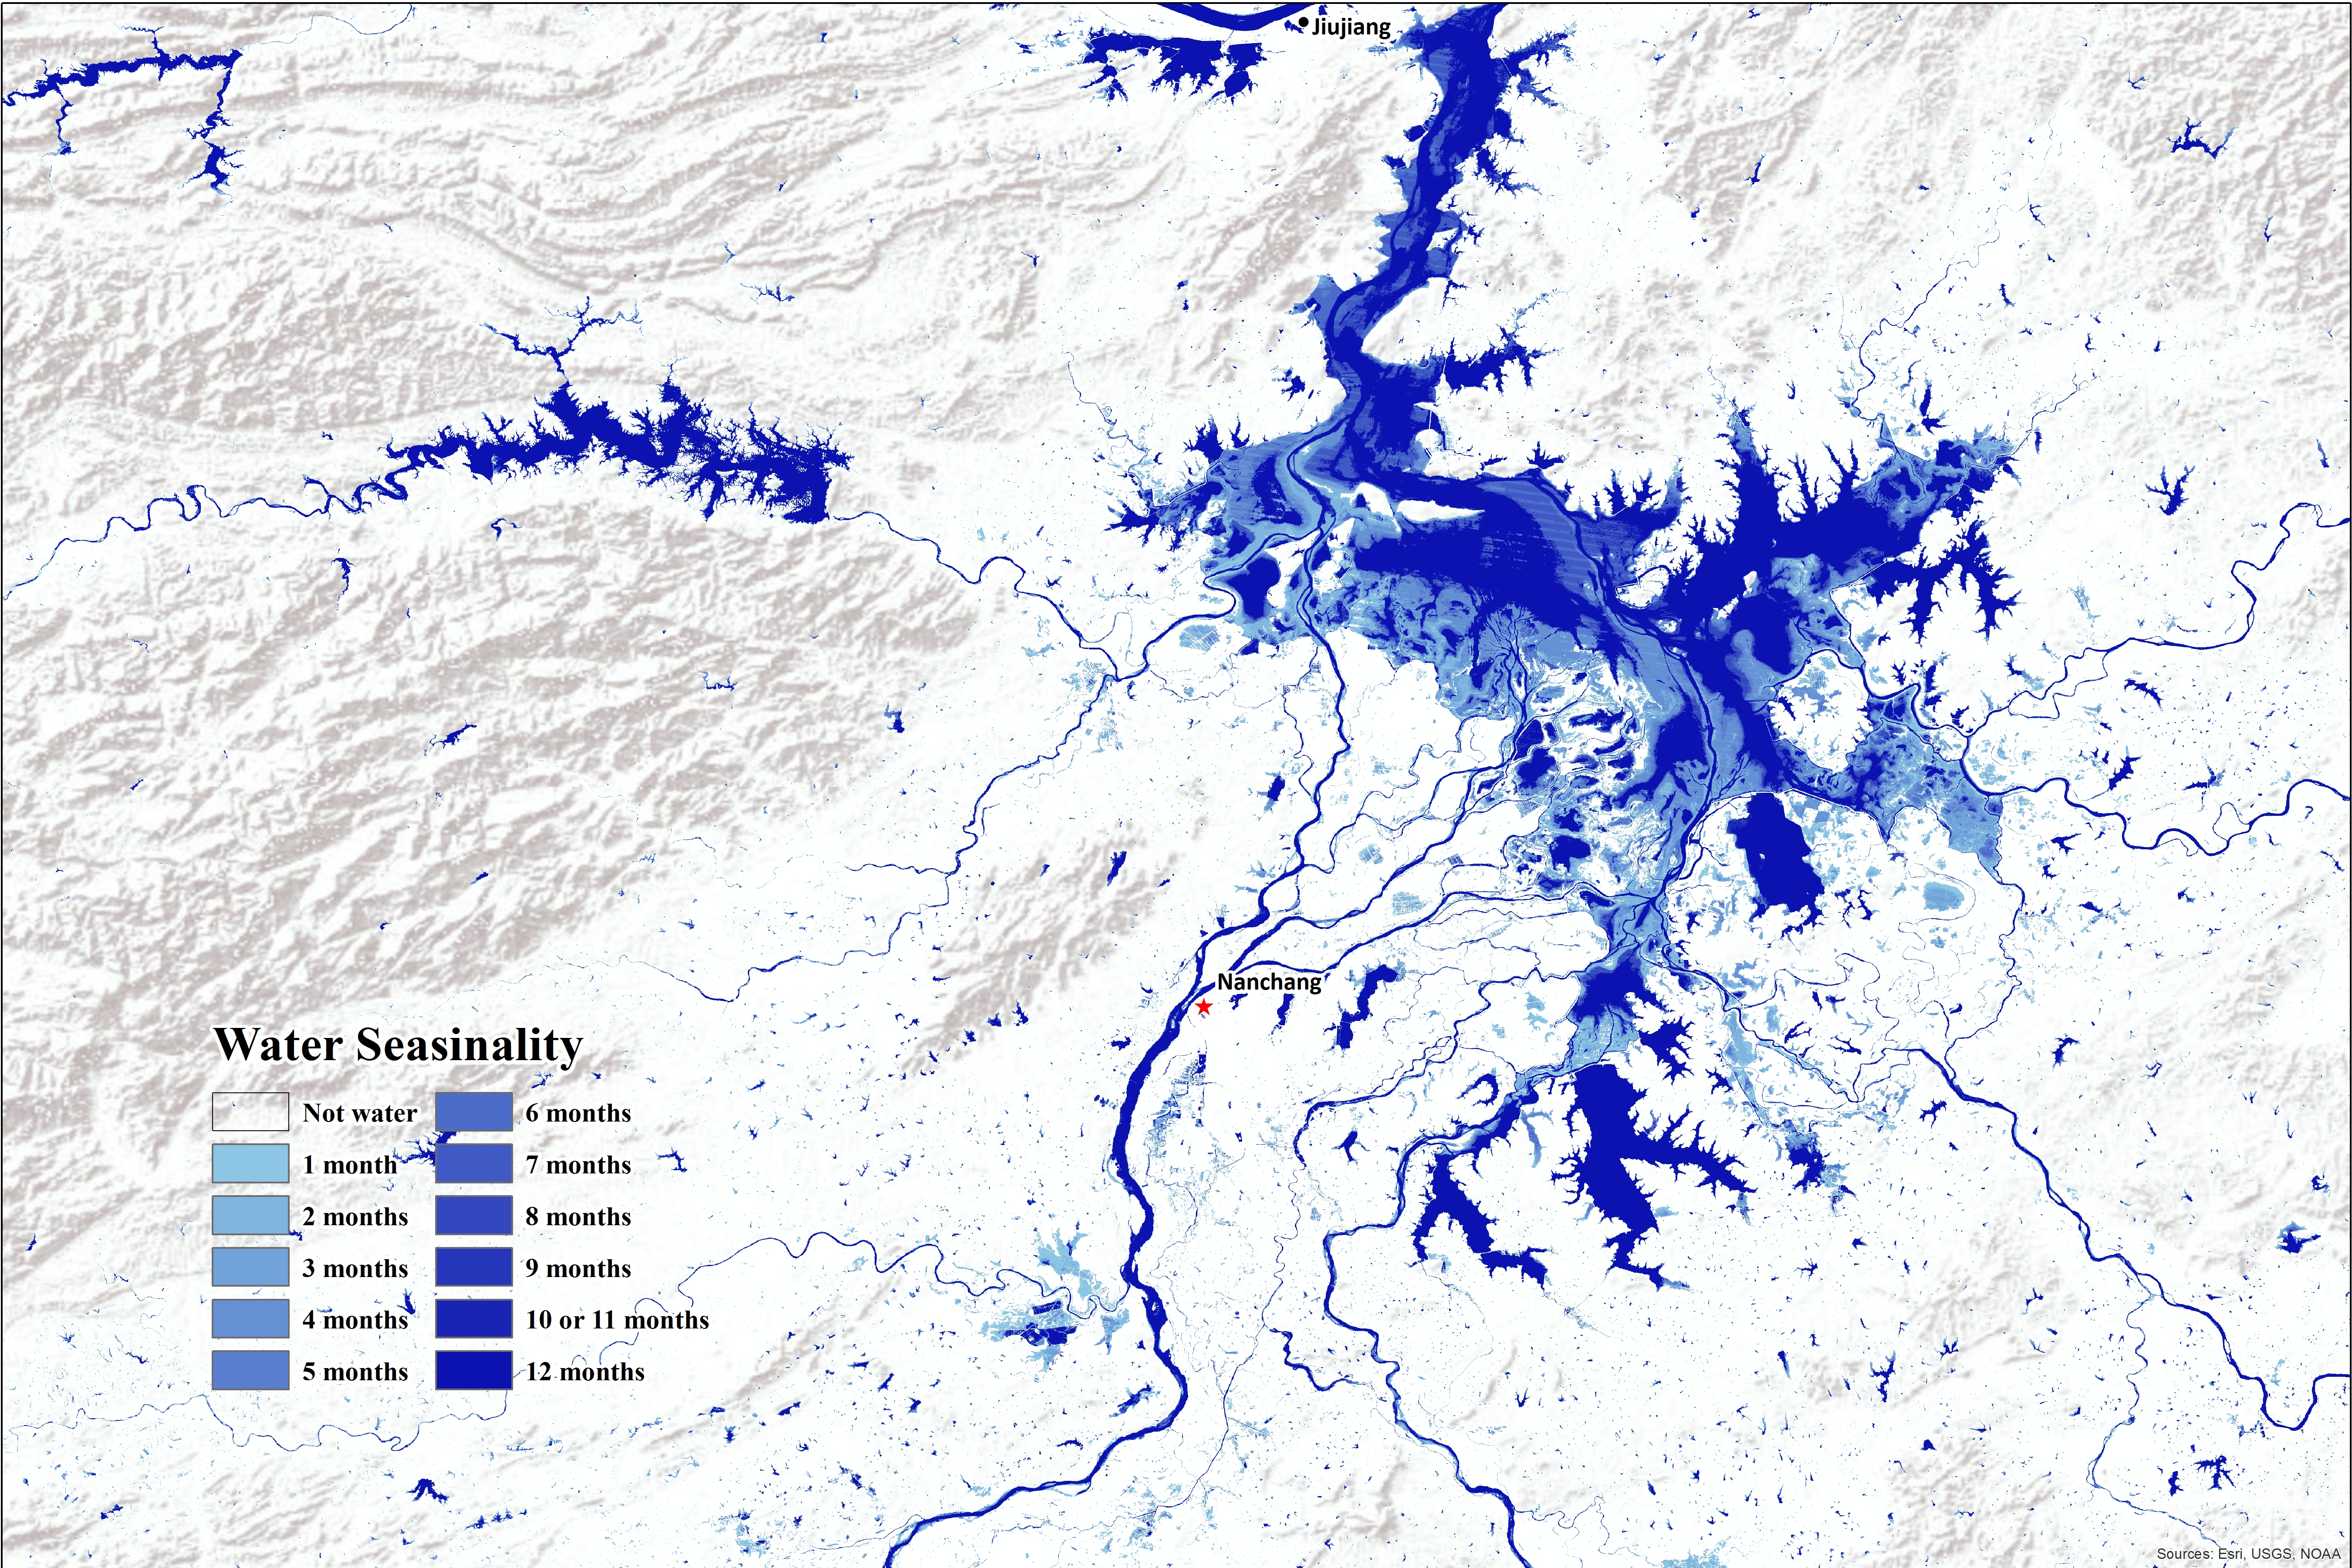
The Surface Water Seasonality map provides information concerning the intra-annual behavior of water surfaces for a single year (2014-2015) and shows permanent and seasonal water and the number of months water was present.
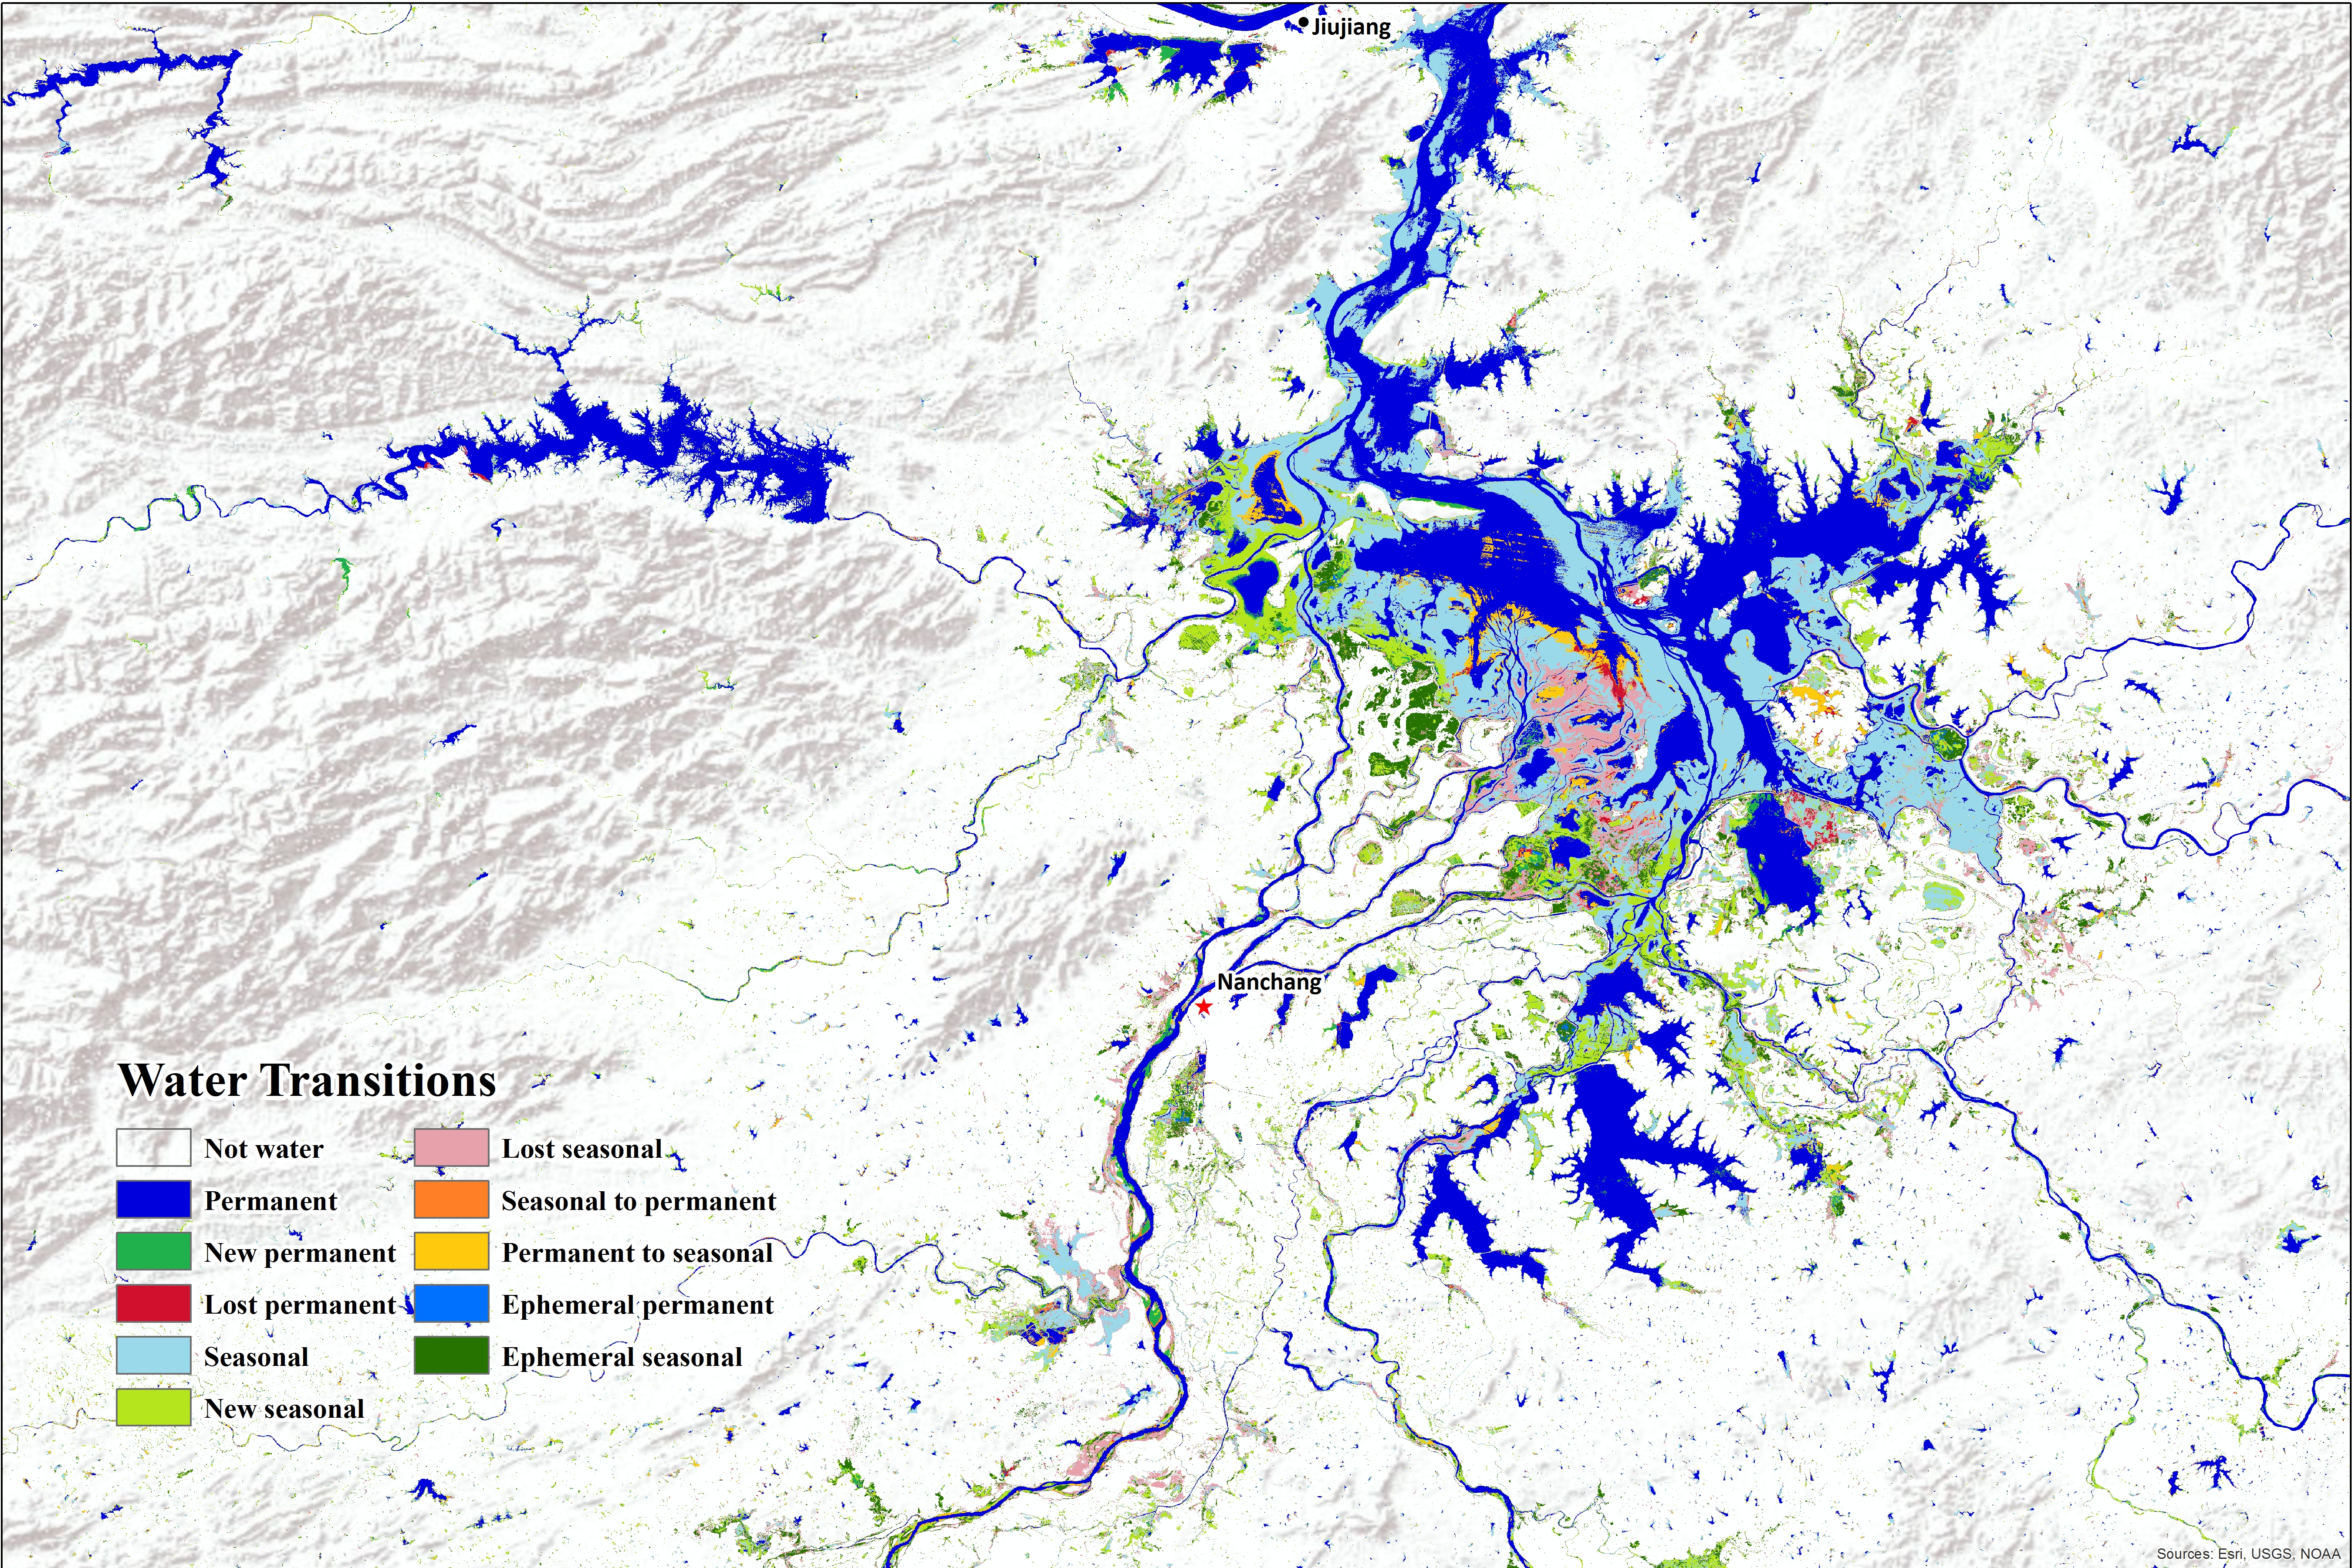
The Surface Water Transitions map provides information on the change in surface water seasonality between the first and last years (between 1984 and 2015) and captures changes between the three classes of not water, seasonal water and permanent water.
*The metadata is acquired from Global Water Surface website, and the basemap is authorized by ESRI World Terrain Map.