|
||||
| |
||||
Ocean-Land-Atmosphere InteractionsCollaborators: Fuyao Wang, Zhengyu Liu, Guangshan Chen, Yafang Zhong Funding: NOAA CPPA Publications: Wang, F., M. Notaro, Z. Liu, and G. Chen, 2014: Observed local and remote influences of vegetation on the Wang, F., Z. Liu, and M. Notaro, 2013: Extracting the dominant SST modes impacting North America’s observed Zhong, Y., Z. Liu, and M. Notaro, 2011: A GEFA assessment of observed global ocean influence on US Methods: The seasonal impacts of the dominant sea surface temperature (SST) modes to North American climate are assessed comprehensively in observations using the multivariate generalized equilibrium feedback assessment (GEFA) method. The GEFA method is first validated before applying it to observations. Impacts of each individual SST mode are quantified and the associated mechanisms are discussed. In later research, we separate the observed impacts of vegetation forcings from oceanic forcings on North American climate using GEFA. Key finding: A comparison between GEFA statistical results and dynamical results in the same global climate model demonstrate the reliability of GEFA at extracting oceanic or terrestrial forcings, thereby allowing its application to observations with confidence. Four critical observed SST modes for North American climate are found: the ENSO mode, Indian Ocean Basin (IOB) mode, North Pacific first empirical orthogonal function (EOF) mode, and tropical Atlantic second EOF mode. The observed influence of North American monsoon region (NAMR) vegetation on the atmosphere peaks in June–August and is primarily attributed to both roughness and hydrological feedbacks. The observed influence of the North American boreal forest (NABF) on the atmosphere peaks in March–May, related to a thermal feedback. |
||
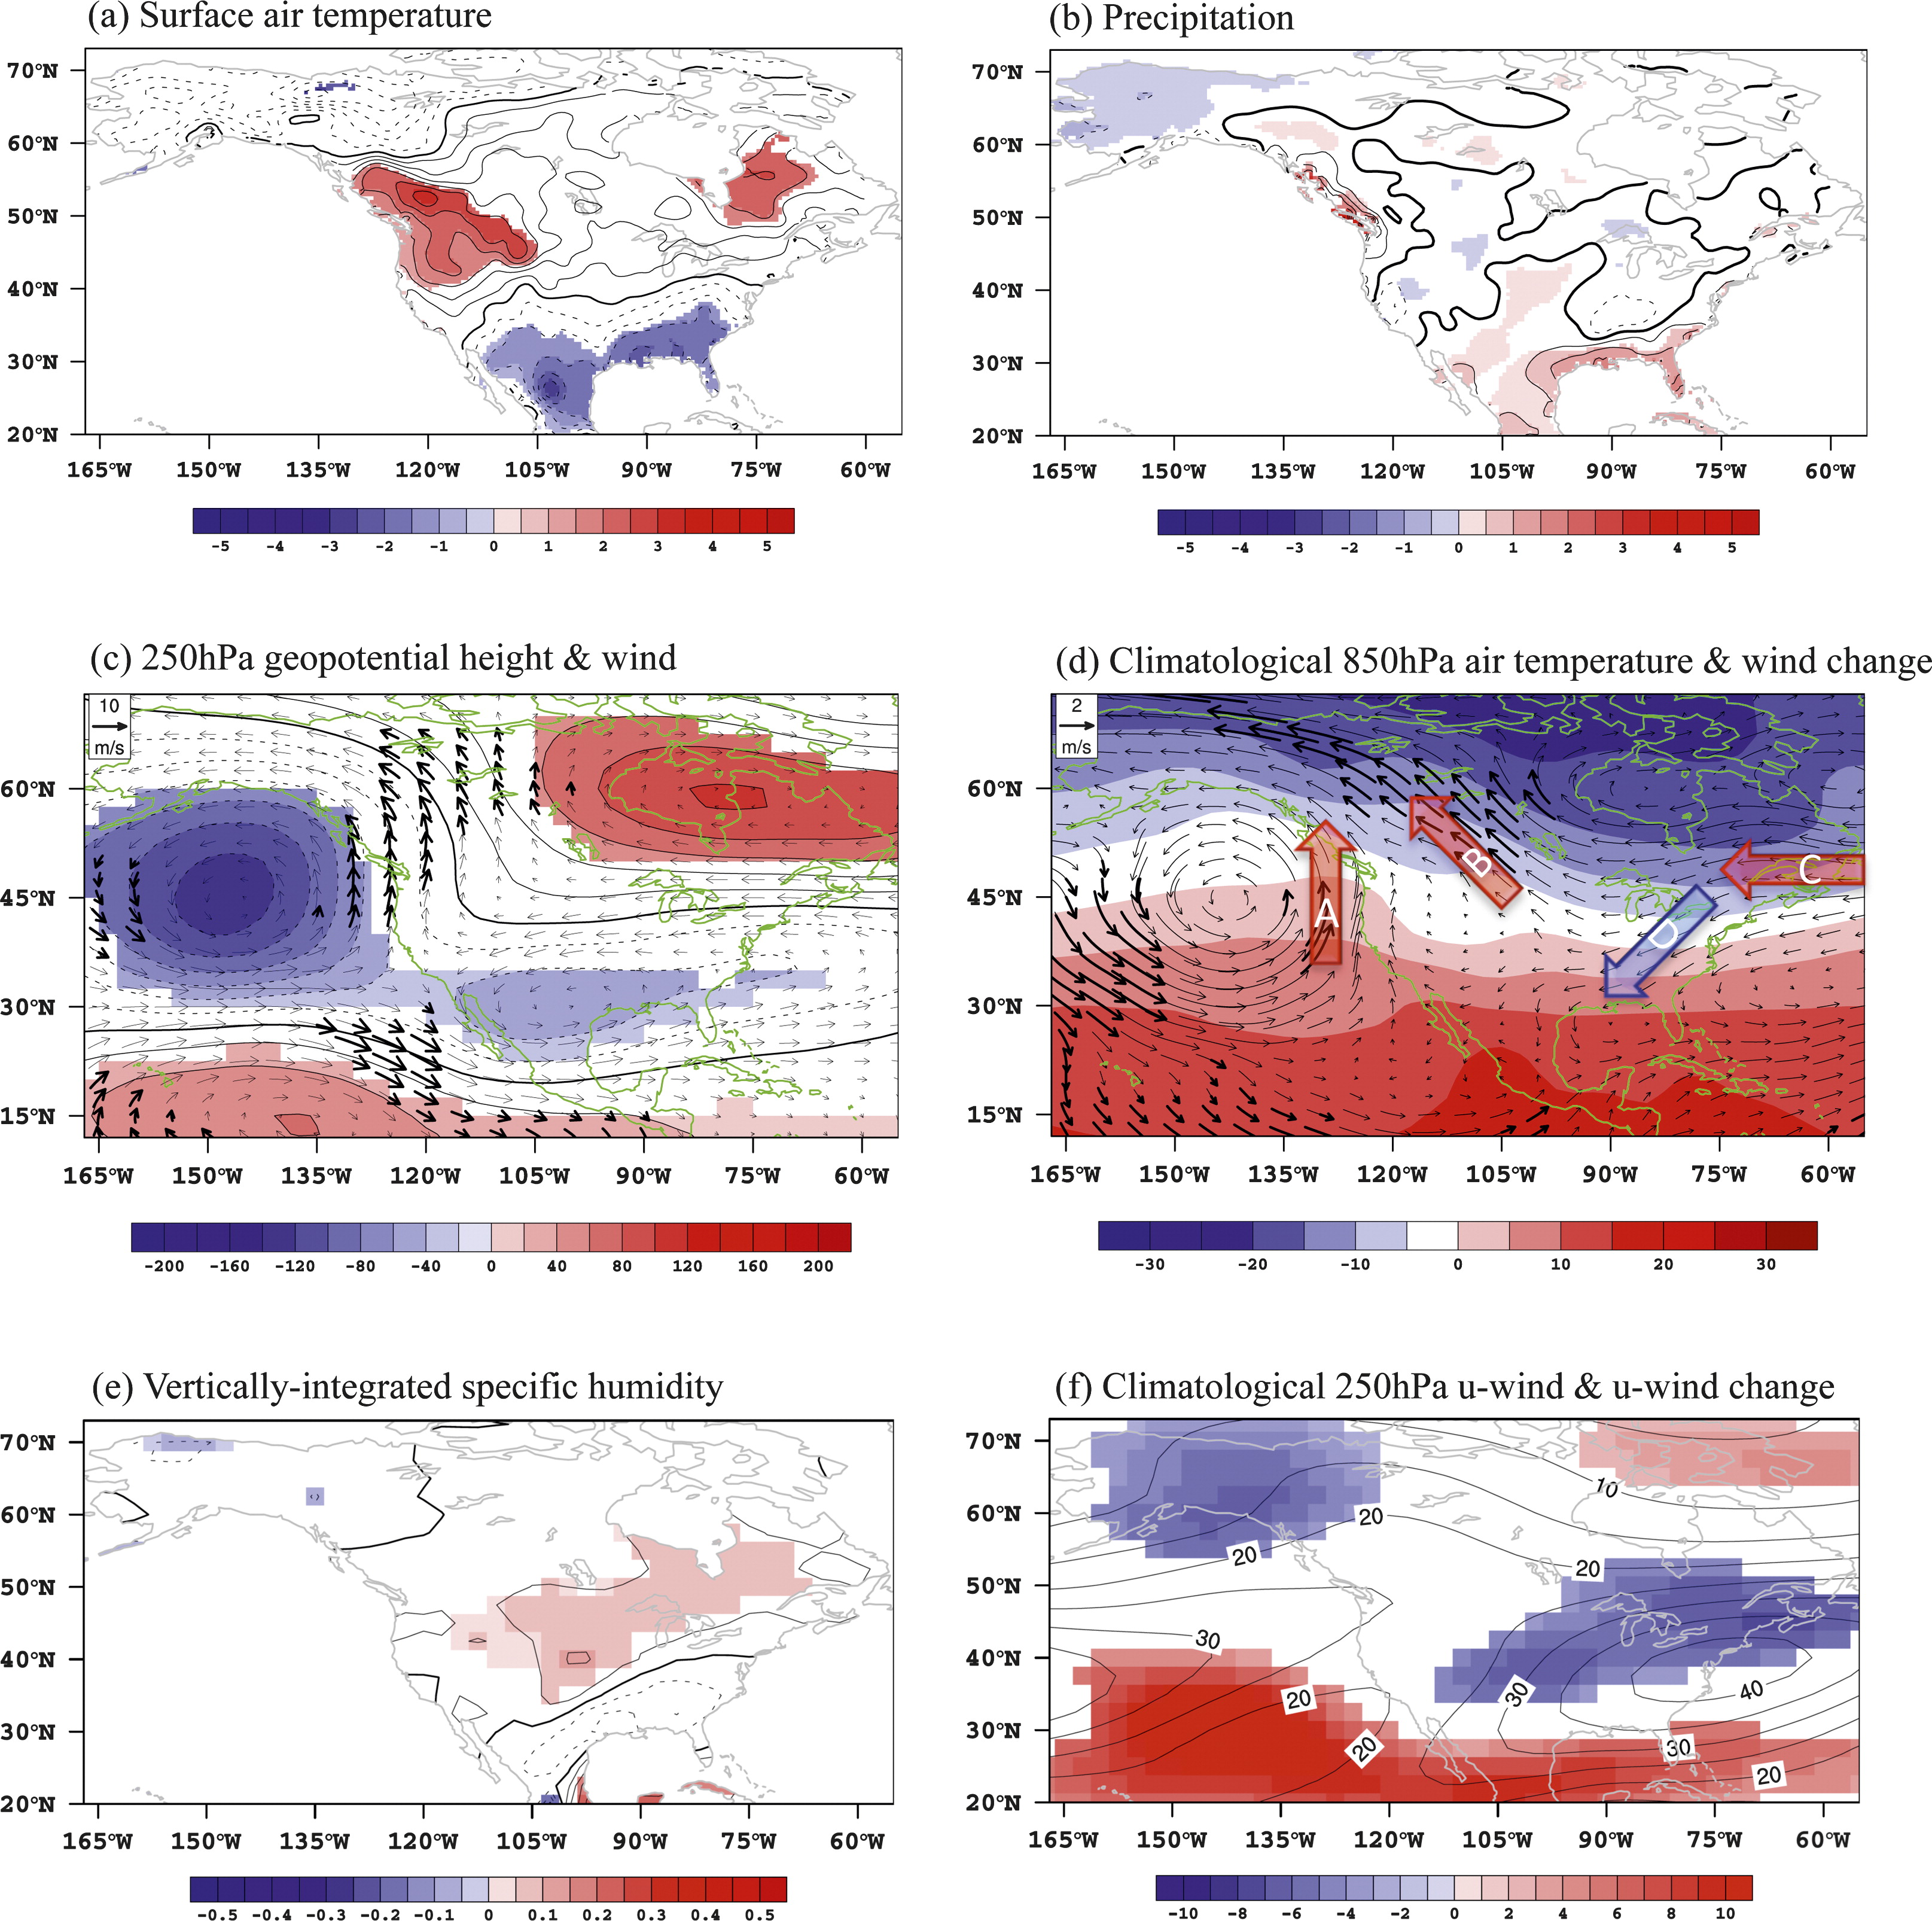 |
The response of (a) surface air temperature (C/C), (b) precipitation (mm/day/C), (c) 250-hPa geopotential height (m/C) and wind (m/s/C), (d) 850-hPa wind (vector; m/s/C) and climatological winter air temperature (shading; C), (e) vertically integrated specific humidity (kg/kg/C), and (f) 250-hPa u-wind (shading; m/s/C) and climatological u-wind (contours; m/s) to warm phase of ENSO during winter in the observations (Wang et al. 2013). Results are derived using the Generalized Equilibrium Feedback Assessment (GEFA). Shading (except in (d)) and thick black vector arrows indicate >90% significance based on Monte Carlo tests. The thick arrows A, B, C, and D in (d) represent temperature advection, with blue for cold advection and red for warm advection. | |