 |
||||
| |
||||
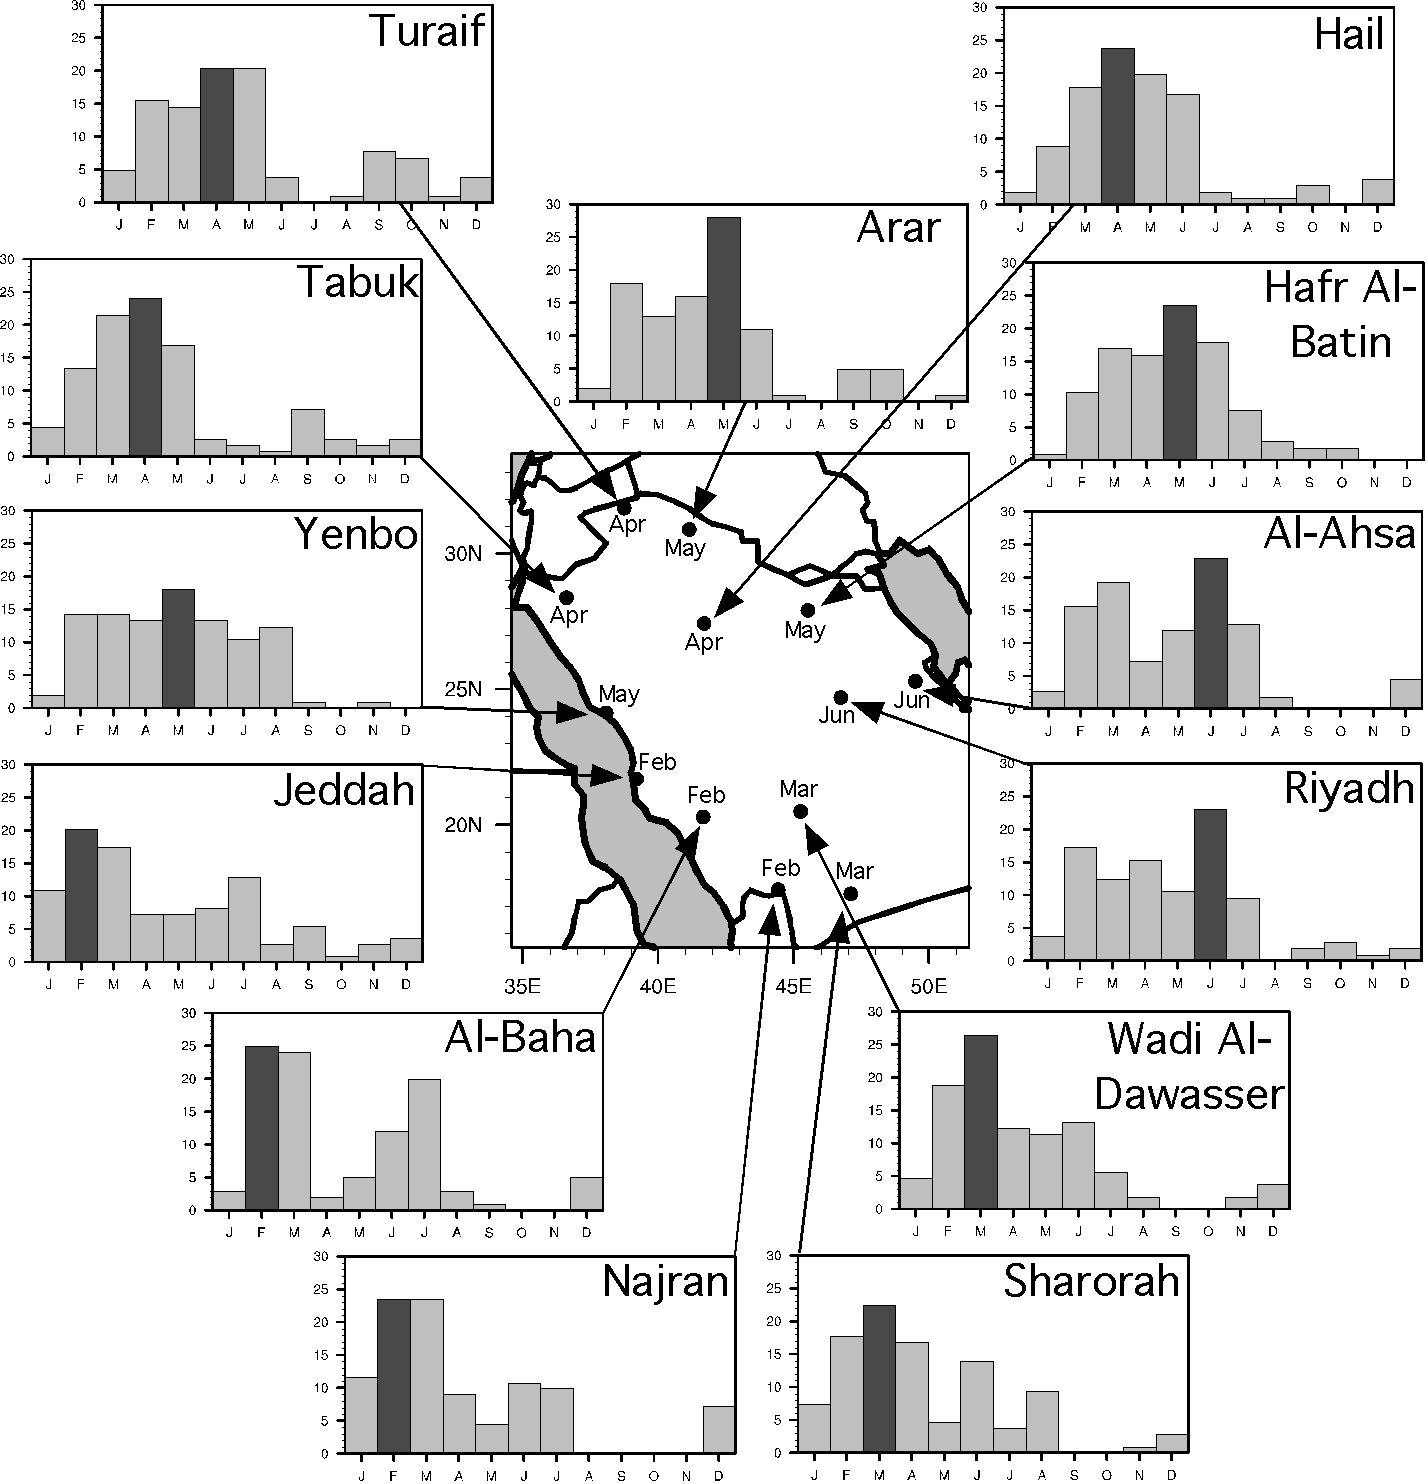
Saudi Arabian Dust StormsCollaborators: Yan Yu, Zhengyu Liu, Fahad Alkolibi, Eyad Fadda, Fawzieh Bakhrjy, Olga Kalashnikova Funding: King Saud University, UW-Madison CPEP Publications: Yu, Y., M. Notaro, Z. Liu, F. Alkolibi, E. Fadda, and F. Bakhrjy, 2014: Climatic controls on the interannual to Notaro, M., F. Alkolibi, E. Fadda, and F. Bakhrjy, 2013: Trajectory analysis of Saudi Arabian dust storms. Journal Yu, Y., M. Notaro, Z. Liu, O. Kalashnikova, F. Alkolibi, E. Fadda, and F. Bakhrjy, 2013: Assessing temporal and Methods: Remotely sensed and ground-based measurements of aerosol optical depth (AOD) are compared with qualitative station observations of dust storm occurrence across Saudi Arabia. For dust storm days at different stations, backward air trajectories are produced using HYSPLIT to investigate dust source regions. A seasonal dust prediction model is developed for Saudi Arabia. Key finding: Saudi Arabian dust storms are most prominent during February–June, with a mid-winter peak along the southern coast of the Red Sea, spring peak across northern Saudi Arabia around the An Nafud Desert, and early summer peak in eastern Saudi Arabia around the Ad Dahna Desert. Based on backward trajectories, the primary local dust source is the Rub Al Khali Desert and the primary remote sources are the Saharan Desert, for western Saudi Arabia, and Iraqi Deserts, for northern and eastern Saudi Arabia. During February–April, the Mediterranean storm track is active, with passing cyclones and associated cold fronts carrying Saharan dust to Saudi Arabian stations along the northern coast of the Red Sea. An effective seasonal dust prediction model is developed for Saudi Arabia that considers regional sea-surface temperatures (e.g. tropical eastern Pacific, tropical Indian, Mediterranean) and cumulative precipitation (both local and remote, over North Africa). |
||
 |
Mean seasonal cycle of the percentage frequency of dust storms at 13 Saudi Arabian stations during 2005-2012 (Notaro et al. 2013). The dark bars indicate the most active month for each station. On the map, the stations' locations are shown, along with the most active month. | |