|
||||
| |
||||
Snowfall Projections for Central-Eastern North America and Wildlife ImplicationsCollaborators: David Lorenz, Chris Hoving, Michael Schummer Funding: Michigan DNR, Upper Midwest and Great Lakes LCC Publications: Notaro, M., D. Lorenz, C. Hoving, and M. Schummer, 2014: 21st century projections of snowfall and winter Methods: Statistically downscaled climate projections from nine global climate models are used to force a snow accumulation and ablation model (SNOW-17) across the central-eastern North American Landscape Conservation Cooperatives (LCCs) to develop high-resolution projections of snowfall, snow depth, and winter severity index (WSI) for the mid- and late 21st century. We use projections of a cumulative WSI (CWSI) known to influence autumn-winter waterfowl migration to demonstrate the utility of SNOW-17 results. Key finding: Annual mean snowfall is simulated to decline across the region, particularly in early winter, leading to a delay in the mean onset of the snow season. Due to a warming-induced acceleration of snowmelt, the percentage loss in snow depth exceeds that of snowfall. Across the Plains and Prairie Potholes LCC and Upper Midwest and Great Lakes LCC, daily snowfall events are projected to become less common, but more intense. The CWSI is projected to decline substantially during December-January, leading to increased likelihood of delays in the timing and intensity of autumn-winter waterfowl migrations. |
||
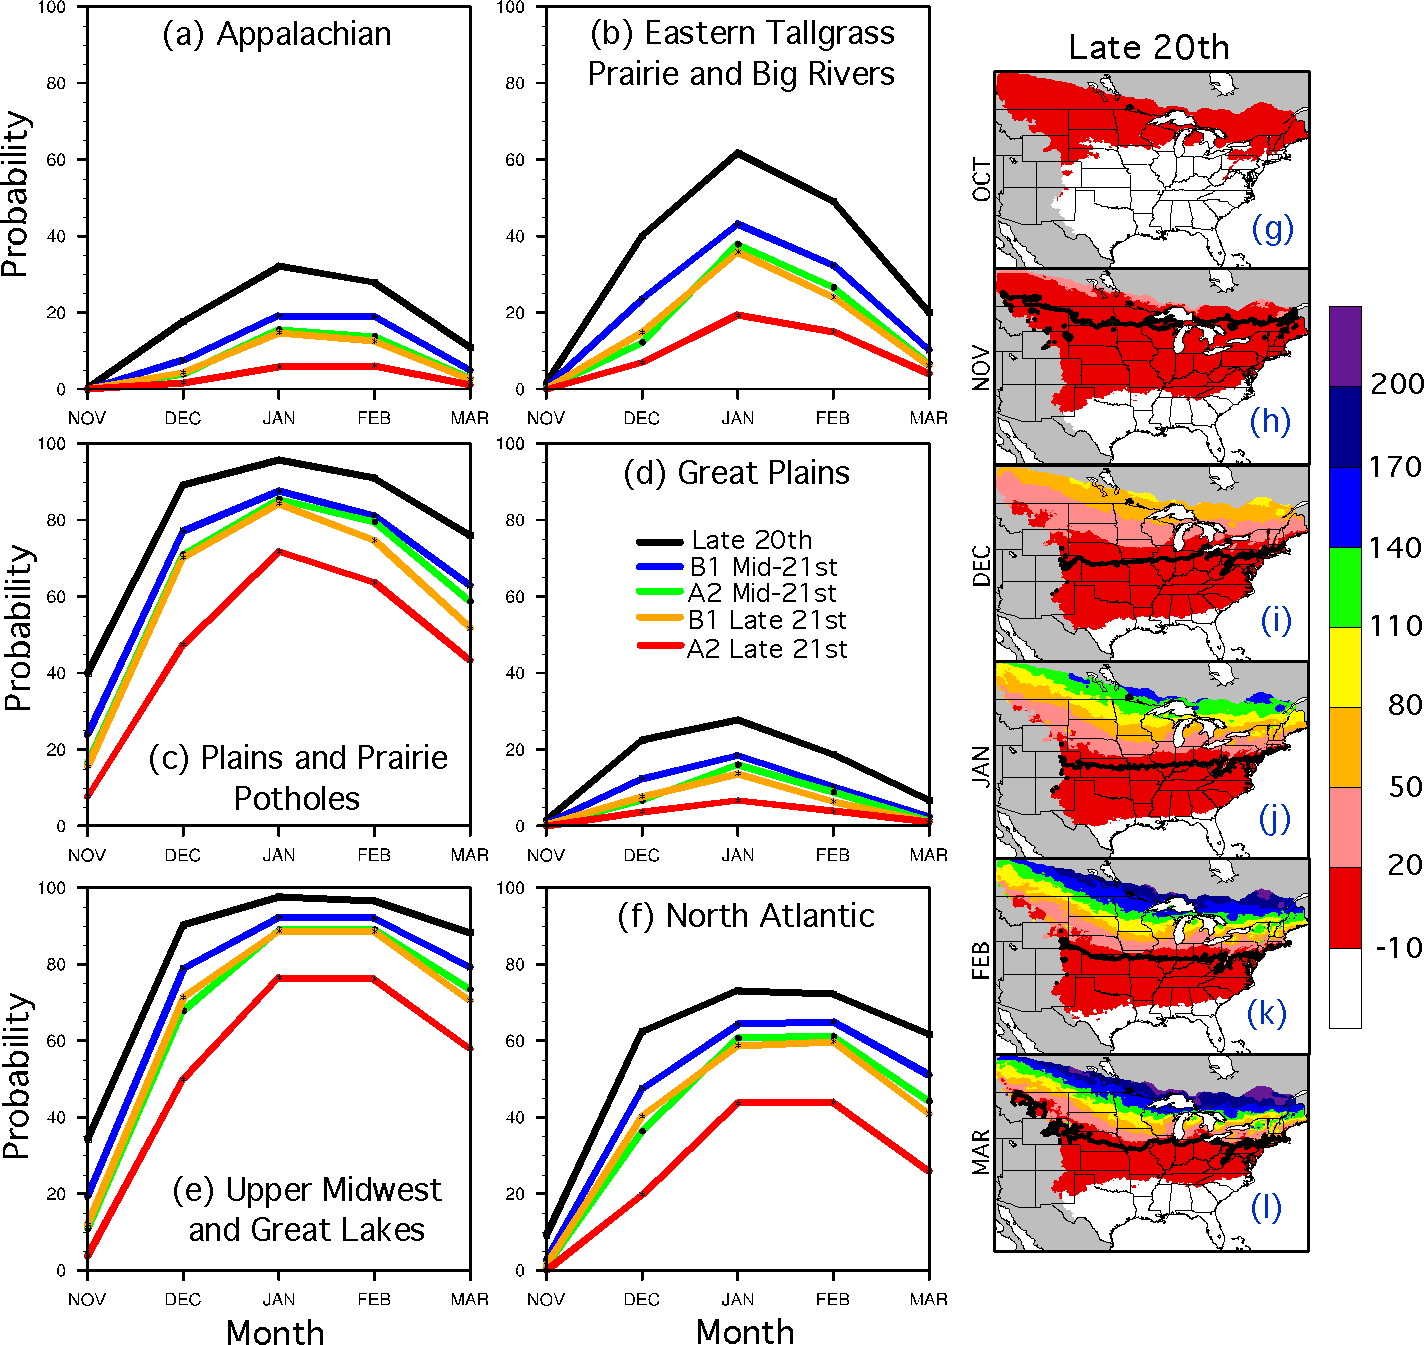 |
(a-f) Mean probability of the daily cumulative winter severity index (CWSI) in specific Landscape Conservation Cooperative (LCC) regions exceeding 7.2 from November to March, for the late 20th century (black), mid-21st century (B1 scenario - blue, A2 scenario - green), and late 21st century (B1 - orange, A2 - red), based on the mean projections from nine global climate models (Notaro et al. 2014). (g-l) Mean CWSI for October-March for the late 20th century. The thick black lines indicate CWSI=7.2, a critical threshold for mallard ducks. Note that the CWSI is cumulatively summed each day from 1 September to 31 March. Projected warming and declining snowpack by the late 21st century may delay the southward migration of dabbling ducks, thereby increasing the foraging pressure in the Great Lakes Basin. | |